


출처
|
const http = require('http')
const url = require('url')
const client = require('prom-client')
// Create a Registry which registers the metrics
const register = new client.Registry()
// Add a default label which is added to all metrics
register.setDefaultLabels({
app: 'example-nodejs-app'
})
// Enable the collection of default metrics
client.collectDefaultMetrics({ register })
// Create a histogram metric
const httpRequestDurationMicroseconds = new client.Histogram({
name: 'http_request_duration_seconds',
help: 'Duration of HTTP requests in microseconds',
labelNames: ['method', 'route', 'code'],
buckets: [0.1, 0.3, 0.5, 0.7, 1, 3, 5, 7, 10]
})
// Register the histogram
register.registerMetric(httpRequestDurationMicroseconds)
// Define the HTTP server
const server = http.createServer(async (req, res) => {
// Start the timer
const end = httpRequestDurationMicroseconds.startTimer()
// Retrieve route from request object
const route = url.parse(req.url).pathname
if (route === '/metrics') {
// Return all metrics the Prometheus exposition format
res.setHeader('Content-Type', register.contentType)
res.end(register.metrics())
}
// End timer and add labels
end({ route, code: res.statusCode, method: req.method })
})
// Start the HTTP server which exposes the metrics on http://localhost:8080/metrics
server.listen(8080)
|
nodejs server.js
프로메테우스 설치
#apt install prometheus
#cd /etc/prometheus
#vi prometheus.yml
| global: scrape_interval: 5s scrape_configs: - job_name: "example-nodejs-app" static_configs: - targets: ["localhost:8080"] |
#service prometheus restart
prometheus_http_request_duration_seconds_bucket
프로메테우스 실행 완료

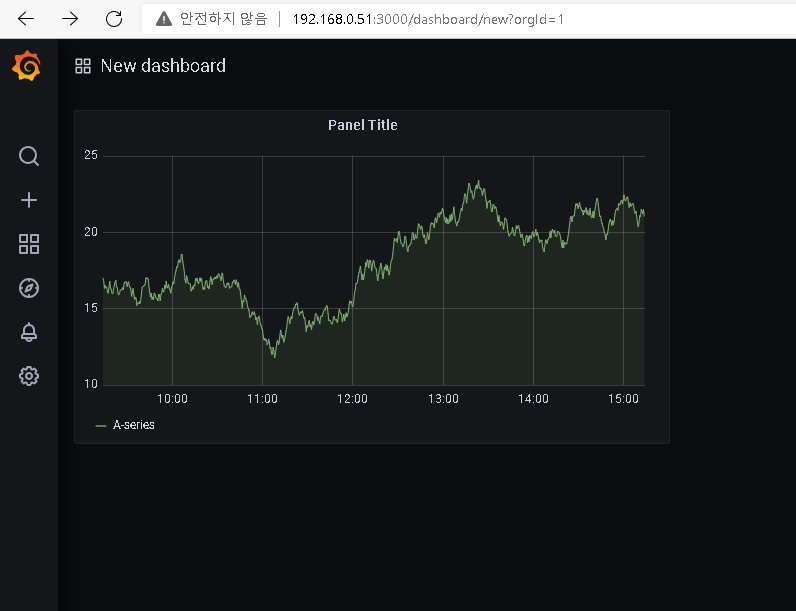
Grafana
#cd /etc/prometheus
#vi datasources.ym
apiVersion: 1 datasources: - name: Prometheus type: prometheus access: proxy orgId: 1 url: http://docker.for.mac.host.internal:9090 basicAuth: false isDefault: true editable: true |
docker run --rm -p 3000:3000 \ -e GF_AUTH_DISABLE_LOGIN_FORM=true \ -e GF_AUTH_ANONYMOUS_ENABLED=true \ -e GF_AUTH_ANONYMOUS_ORG_ROLE=Admin \ -v `pwd`/datasources.yml://etc/prometheus \ grafana/grafana-enterprise:8.3.6-ubuntu |
'시스템' 카테고리의 다른 글
| MongoDB Replica Set (0) | 2023.01.10 |
|---|---|
| s3 권한이 없는 경우 (0) | 2022.05.17 |
| nginx/1.18.0 (Ubuntu20.04) gzip (0) | 2022.03.07 |
| nginx/1.18.0 (Ubuntu20.04) brotli (0) | 2022.01.11 |
| Gitlab CI react app 배포 (0) | 2021.12.31 |

iesay